Business intelligence: Methodology, Tools, Benefits; A Brief Discussion
Introduction Business intelligence (BI) is a technology-driven system for analysis of data and presenting important and valuable information to executives, business planners and other end users make more efficient decisions. BI encloses with a variety of tools, applications and concepts that ...
Introduction
Business intelligence (BI) is a technology-driven system for analysis of data and presenting important and valuable information to executives, business planners and other end users make more efficient decisions. BI encloses with a variety of tools, applications and concepts that capacitate organizations to collect data from internal and external sources. Then analyse it for develop and functionate queries against the data, and create reports, dashboards and data presentation to make the analytical findinds available to make corporate decisions.
The concept of Business Intelligence (BI) is brought up by Gartner Group since 1996. It is defined as the application of a set of methodologies and technologies, such as J2EE, DOTNET, Web Services, XML, data warehouse, OLAP, Data Mining, representation technologies, etc, to improve enterprise operation effectiveness, support management/decision to achieve competitive advantages.
Well-designed BI applications can give anyone in your company the ability to make better decisions by quickly understanding the various “information assets” in your organization and how these interact with each other. These assets can include customer databases, supply chain information, personnel data, manufacturing, product data, sales and marketing activity, as well as any other source of information critical to your operation. A robust BI application, which includes integration and data cleansing functions, can allow you to integrate these disparate data sources into a single coherent framework for real-time reporting and detailed analysis by anyone in your extended enterprise – customers, partners, employees, managers, and executives.
COMPONENTS OF BI
-
OLAP (On-line analytical processing):
It refers to the way in which executives can slice and dice their way through data using sophisticated tools that allow for the navigation of dimensions such as time or hierarchies. Online Analytical Processing or OLAP provides multidimensional, summarized views of business data and is used for reporting, analysis, modeling and planning for optimizing the business. OLAP techniques and tools can be used to work with data warehouses or data marts designed for sophisticated enterprise intelligence systems. These systems process queries required to discover trends and analyze critical factors. Reporting software generates aggregated views of data to keep the management informed about the state of their business. Other BI tools are used to store and analyze data, such as data mining and data warehouses; decision support systems and forecasting; document warehouses and document management; knowledge management; mapping, information visualization and dash boarding; management information systems, geographic information systems; Trend Analysis; Software as a Service (SaaS).
-
Advanced Analytics:
it is referred to as data mining, forecasting or predictive analytics, this takes advantage of statistical analysis techniques to predict or provide certainty measures on facts.
-
Corporate Performance Management (Portals, Scorecards, Dashboards):
This general category usually provides a container for several pieces to plug into so that the aggregate tells a story. For example, a balanced scorecard that displays portlets for financial metrics combined with say organizational learning and growth metrics.
-
Real time BI:
It allows for the real time distribution of metrics through email, messaging systems and/or interactive displays.
-
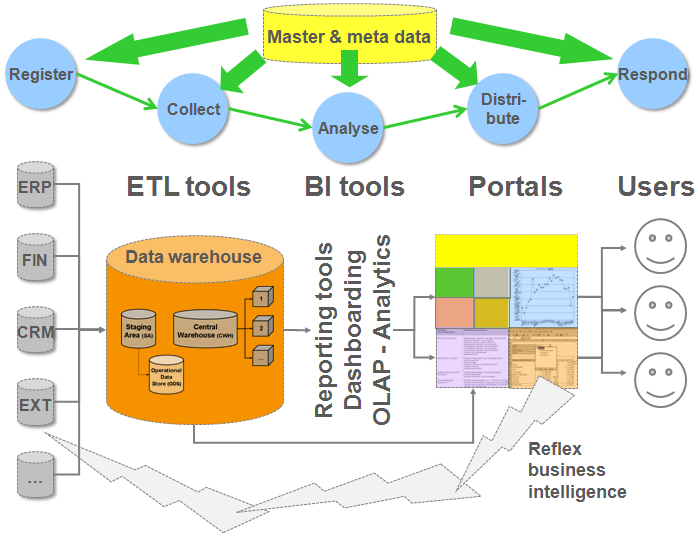
Data Warehouse and data marts:
The data warehouse is the significant component of business intelligence. It is subject oriented,integrated. The data warehouse supports the physical propagation of data by handling the numerous enterprise records for integration, cleansing, aggregation and query tasks. It can also contain the operational data which can be defined as an updateable set of integrated data used for enterprise wide tactical decision-making of a particular subject area. It contains live data, not snapshots, and retains minimal history. Data sources can be operational databases, historical data, external data for example, from market research companies or from the Internet), or information from the already existing data warehouse environment. The data sources can be relational databases or any other data structure that supports the line of business applications. They also can reside on many different platforms and can contain structured information, such as tables or spreadsheets, or unstructured information, such as plaintext files or pictures and other multimedia information. A data mart is a collection of subject areas organized for decision support based on the needs of a given department. Finance has their data mart, marketing has theirs, and sales have theirs and so on. And the data mart for marketing only faintly resembles anyone else's data mart.
BI tools are widely accepted as a new middleware between transactional applications and decision support applications, thereby decoupling systems tailored to an efficient handling of business transactions from systems tailored to an efficient support of business
decisions.
BENEFITS OF BI
The likey benefits of BI programs include
(1) speeding up and strengthening decision making;
(2) optimizing internal business processes;
(3) increasing work efficiency;
(4) finding new revenues sources;
(5) gaining competitive advantages over business competitors.
(6) by converting business knowledge via the analytical intelligence to solve many business issues.
(7) identify their most profitable customers and the underlying reasons for those customers’ loyalty
(8) Analyze click-stream data to improve ecommerce strategies.
(9) Analyze potential growth customer profitability and reduce risk exposure through more accurate financial credit scoring of their customers.