Chẩn đoán bệnh viêm phổi từ ảnh chụp X-Quang bằng Deep learning
Ứng dụng của AI nói chung và Deep learning nói riêng ngày càng trở nên phổ biến trong cuộc sống con người. AI đã có thể làm thay con người trong nhiều lĩnh vực, với những dữ liệu đã được tổng hợp và lưu trữ bằng máy tính sẽ giúp AI ngày càng thông minh hơn. Một trong những lĩnh vực mà AI có thể áp ...
Ứng dụng của AI nói chung và Deep learning nói riêng ngày càng trở nên phổ biến trong cuộc sống con người. AI đã có thể làm thay con người trong nhiều lĩnh vực, với những dữ liệu đã được tổng hợp và lưu trữ bằng máy tính sẽ giúp AI ngày càng thông minh hơn. Một trong những lĩnh vực mà AI có thể áp dụng vào rất tốt đó là lĩnh vực y tế, đó cũng là tiềm năng rất lớn ở Việt Nam cũng như trên thế giới. Hôm nay mình sẽ giới thiệu tới các bạn 1 bài toán khá thú vị về medical image analysis, ứng dụng Chẩn đoán bệnh viêm phổi, sử dụng Deeplearning và các kỹ thuật liên quan đến dữ liệu và tối ưu hiệu quả mô hình.
Viêm phổi là một bệnh khá phổ biến, nguyên nhân của bệnh viêm phổi có thể là do:
- Viêm phổi do vi khuẩn
- Viêm phổi do virus
- Viêm phổi do nấm
- Viêm phổi do hóa chất
Vì các dạng bệnh được thể hiện trên film chụp X-Quang là khác nhau nên phạm vi bài toán này chỉ giải quyết việc chẩn đoán bệnh cho nguyên nhân 1 và 2.
Dựa vào các hình ảnh chụp X-Quang ta sẽ tiến hành phân loại thành 2 loại: mắc bệnh và không mắc bệnh. Đây là bài toán phân loại hình ảnh bình thường, tuy nhiên đây chỉ là một mô hình để các bạn học tập nên bộ dữ liệu mẫu rất ít, đòi hỏi chũng ta phải hiểu cách thức hoạt động của mô hình để xây dựng 1 mô hình chấp nhận được ngay cả với một lượng dữ liệu hạn chế. Để thực hiện việc này chúng ta sẽ sử dụng mạng CNN (VGG16), có sử dụng transfer learning và data augmentation để cải thiện hiệu quả huấn luyện mô hình
Dữ liệu được public trong y tế rất ít và chúng ta chỉ đang nghiên cứu nên bộ dataset có được cũng khá hạn chế ^^. Bộ dữ liệu được sử dụng mình lấy trên Kaggle với dung lượng ~1Gb
Reference: https://www.kaggle.com/paultimothymooney/chest-xray-pneumonia
Bộ dataset này gồm 3 thư mục (train, test, val) và trong mỗi thư mục sẽ là các loại tương ứng (Pneumonia/Normal). Có tất cả 5,863 ảnh JPEG đã được các bác sỹ chuyên khoa phân loại bằng tay và chia làm 2 loại.
Tải về tại đây
Import thư viện
import os
import glob
import h5py
import shutil
import imgaug as aug
import numpy as np # linear algebra
import pandas as pd # data processing, CSV file I/O (e.g. pd.read_csv)
import seaborn as sns
import matplotlib.pyplot as plt
import matplotlib.image as mimg
import imgaug.augmenters as iaa
from os import listdir, makedirs, getcwd, remove
from os.path import isfile, join, abspath, exists, isdir, expanduser
from PIL import Image
from pathlib import Path
from skimage.io import imread
from skimage.transform import resize
from keras.models import Sequential, Model
from keras.applications.vgg16 import VGG16, preprocess_input
from keras.preprocessing.image import ImageDataGenerator,load_img, img_to_array
from keras.models import Sequential
from keras.layers import Conv2D, MaxPooling2D, Dense, Dropout, Input, Flatten, SeparableConv2D
from keras.layers import GlobalMaxPooling2D
from keras.layers.normalization import BatchNormalization
from keras.layers.merge import Concatenate
from keras.models import Model
from keras.optimizers import Adam, SGD, RMSprop
from keras.callbacks import ModelCheckpoint, Callback, EarlyStopping
from keras.utils import to_categorical
from sklearn.model_selection import train_test_split
from sklearn.preprocessing import StandardScaler
from mlxtend.plotting import plot_confusion_matrix
from sklearn.metrics import confusion_matrix
import cv2
from keras import backend as K
color = sns.color_palette()
%matplotlib inline

# Input data files are available in the "../input/" directory.
# For example, running this (by clicking run or pressing Shift+Enter) will list the files in the input directory
print(os.listdir("../input"))
Dữ liệu sẽ nằm trong thư mục ../input
Thiết lập một số tham số cho Keras và tensorflow
import tensorflow as tf
# Set the seed for hash based operations in python
os.environ['PYTHONHASHSEED'] = '0'
# Set the numpy seed
np.random.seed(111)
# Disable multi-threading in tensorflow ops
session_conf = tf.ConfigProto(intra_op_parallelism_threads=1, inter_op_parallelism_threads=1)
# Set the random seed in tensorflow at graph level
tf.set_random_seed(111)
# Define a tensorflow session with above session configs
sess = tf.Session(graph=tf.get_default_graph(), config=session_conf)
# Set the session in keras
K.set_session(sess)

# Make the augmentation sequence deterministic
aug.seed(111)
Tiến hành phân chia dữ liệu
# Define path to the data directory
data_dir = Path('../input/chest-xray-pneumonia/chest_xray/chest_xray')
# Path to train directory (Fancy pathlib...no more os.path!!)
train_dir = data_dir / 'train'
# Path to validation directory
val_dir = data_dir / 'val'
# Path to test directory
test_dir = data_dir / 'test'
Chúng ta đi thử vào 1 thư mục trong tập training, mỗi thư mục sẽ chứa 2 thư mục con:
NORMAL: Các ảnh được đánh nhãn là không bị bệnh PNEUMONIA: Thư mục gồm các ảnh đánh nhãn là bị mắc bệnh
# Get the path to the normal and pneumonia sub-directories
normal_cases_dir = train_dir / 'NORMAL'
pneumonia_cases_dir = train_dir / 'PNEUMONIA'
# Get the list of all the images
normal_cases = normal_cases_dir.glob('*.jpeg')
pneumonia_cases = pneumonia_cases_dir.glob('*.jpeg')
# An empty list. We will insert the data into this list in (img_path, label) format
train_data = []
# Go through all the normal cases. The label for these cases will be 0
for img in normal_cases:
    train_data.append((img,0))

# Go through all the pneumonia cases. The label for these cases will be 1
for img in pneumonia_cases:
    train_data.append((img, 1))

# Get a pandas dataframe from the data we have in our list
train_data = pd.DataFrame(train_data, columns=['image', 'label'],index=None)

# Shuffle the data
train_data = train_data.sample(frac=1.).reset_index(drop=True)
Chúng ta in thử kết quả
train_data.head()
| image | label | |
|---|---|---|
| 0 | ../input/chest-xray-pneumonia/chest_xray/chest... | 0 |
| 1 | ../input/chest-xray-pneumonia/chest_xray/chest... | 0 |
| 2 | ../input/chest-xray-pneumonia/chest_xray/chest... | 1 |
| 3 | ../input/chest-xray-pneumonia/chest_xray/chest... | 1 |
| 4 | ../input/chest-xray-pneumonia/chest_xray/chest... | 1 |
Thống kê về tập dữ liệu, số lượng các mẫu bị bênh / không bị bệnh
# Get the counts for each class
cases_count = train_data['label'].value_counts()
print(cases_count)

# Plot the results
plt.figure(figsize=(10,8))
sns.barplot(x=cases_count.index, y= cases_count.values)
plt.title('Number of cases', fontsize=14)
plt.xlabel('Case type', fontsize=12)
plt.ylabel('Count', fontsize=12)
plt.xticks(range(len(cases_count.index)), ['Normal(0)', 'Pneumonia(1)'])
plt.show()
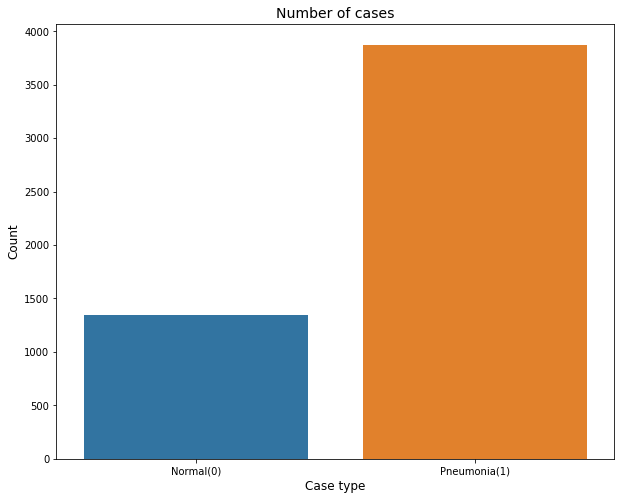
Chúng ta có nhận xét sơ bộ về dữ liệu: Các trường hợp bị viêm phổi gấp 3 lần các trường hợp bình thường. Điều này rất bình thường trong các dữ liệu về y tế, dữ liệu sẽ bị không đồng đều, có quá nhiều trường hợp bình thường hoặc có quá nhiều trường hợp bị bệnh. Chúng ta hiển thị thử xem một vài mẫu từ dữ liệu training xem sao:
# Get few samples for both the classes
pneumonia_samples = (train_data[train_data['label']==1]['image'].iloc[:5]).tolist()
normal_samples = (train_data[train_data['label']==0]['image'].iloc[:5]).tolist()

# Concat the data in a single list and del the above two list
samples = pneumonia_samples + normal_samples
del pneumonia_samples, normal_samples

# Plot the data
f, ax = plt.subplots(2,5, figsize=(30,10))
for i in range(10):
    img = imread(samples[i])
    ax[i//5, i%5].imshow(img, cmap='gray')
    if i<5:
        ax[i//5, i%5].set_title("Pneumonia")
    else:
        ax[i//5, i%5].set_title("Normal")
    ax[i//5, i%5].axis('off')
    ax[i//5, i%5].set_aspect('auto')
plt.show()
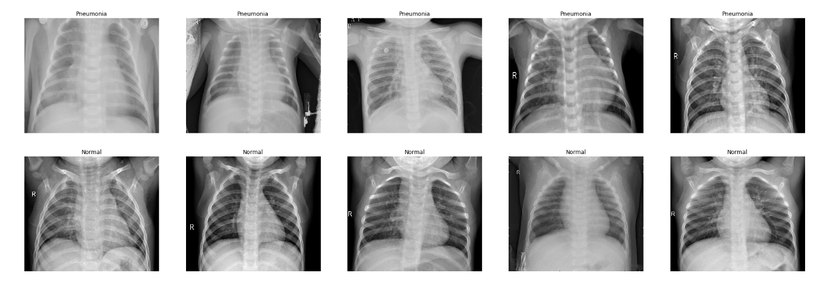
Bằng mắt thường chúng ta khó có thể phân biệt được đâu là trường hợp bị bệnh, đâu là trường hợp không bị bệnh. Vì vậy nếu có thể xây dựng được một mô hình mạnh mẽ thì hẳn sẽ cực kì có ích với bác sỹ