Nhận diện biển báo giao thông
Như tiêu đề, hôm nay mình sẽ hướng dẫn các bạn xây dựng một mạng CNN đơn giản để nhận diện biển báo giao thông. Với tập dữ liệu gồm tất cả 42 biển báo giao thông với các điều kiện khác nhau như thiếu sáng, biển báo bị nghiêng, ảnh chụp mờ... Bài toán yêu cầu đầu vào là 1 ảnh chụp được từ ...
Như tiêu đề, hôm nay mình sẽ hướng dẫn các bạn xây dựng một mạng CNN đơn giản để nhận diện biển báo giao thông. Với tập dữ liệu gồm tất cả 42 biển báo giao thông với các điều kiện khác nhau như thiếu sáng, biển báo bị nghiêng, ảnh chụp mờ...

Bài toán yêu cầu đầu vào là 1 ảnh chụp được từ biển báo giao thông và đầu ra là tên tương ứng của biển báo, với số lượng biển báo giao thông là cố định và đây là bài toán phân biệt nên chúng ta sẽ coi đây là bài toán phân loại ảnh, với số lớp cần phân loại chính là số lượng loại biển báo giao thông cần xác định. Vì hình ảnh các biển báo rất khác nhau và có thể dễ dàng phân biệt bằng mắt thường nên dữ liệu phân lớp khá đơn giản và ít sự nhập nhằng. Vì thế chúng ta sẽ cần một mô hình deep learning đơn giản là có thể xử lý được việc này.
Import thư viện
# Libraries
import numpy as np
import pandas as pd
import matplotlib.pyplot as plt
import tensorflow as tf
import cv2
from PIL import Image
import os
Đầu tiên bạn vào đây để tải về bộ dữ liệu gồm các biển báo đã được đánh nhãn và lưu các thông tin trong file csv. Đây là bộ dữ liệu biển báo giao thông của Đức, gồm 42 loại biển báo khác nhau. Bạn tải về và giải nén ra thư mục của project

# Reading the input images and putting them into a numpy array
data=[]
labels=[]

height = 30
awidth = 30
channels = 3
classes = 43
n_inputs = height * awidth*channels

for i in range(classes) :
    path = "../input/train/{0}/".format(i)
    print(path)
    Class=os.listdir(path)
    for a in Class:
        try:
            image=cv2.imread(path+a)
            image_from_array = Image.fromarray(image, 'RGB')
            size_image = image_from_array.resize((height, awidth))
            data.append(np.array(size_image))
            labels.append(i)
        except AttributeError:
            print(" ")

Cells=np.array(data)
labels=np.array(labels)

#Randomize the order of the input images
s=np.arange(Cells.shape[0])
np.random.seed(43)
np.random.shuffle(s)
Cells=Cells[s]
labels=labels[s]
Bạn đổi lại biến path theo đường dẫn trên máy bạn
Như các bài thông thường, chúng ta sẽ tiến hành chia tập dữ liệu ảnh thành tập train và tập validation
#Spliting the images into train and validation sets
(X_train,X_val)=Cells[(int)(0.2*len(labels)):],Cells[:(int)(0.2*len(labels))]
X_train = X_train.astype('float32')/255
X_val = X_val.astype('float32')/255
(y_train,y_val)=labels[(int)(0.2*len(labels)):],labels[:(int)(0.2*len(labels))]

#Using one hote encoding for the train and validation labels
from keras.utils import to_categorical
y_train = to_categorical(y_train, 43)
y_val = to_categorical(y_val, 43)
Với các label chúng ta sẽ chuyển sang dạng One-hot encoding để xử lý
#Definition of the DNN model

from keras.models import Sequential
from keras.layers import Conv2D, MaxPool2D, Dense, Flatten, Dropout

model = Sequential()
model.add(Conv2D(filters=32, kernel_size=(5,5), activation='relu', input_shape=X_train.shape[1:]))
model.add(Conv2D(filters=32, kernel_size=(5,5), activation='relu'))
model.add(MaxPool2D(pool_size=(2, 2)))
model.add(Dropout(rate=0.25))
model.add(Conv2D(filters=64, kernel_size=(3, 3), activation='relu'))
model.add(Conv2D(filters=64, kernel_size=(3, 3), activation='relu'))
model.add(MaxPool2D(pool_size=(2, 2)))
model.add(Dropout(rate=0.25))
model.add(Flatten())
model.add(Dense(256, activation='relu'))
model.add(Dropout(rate=0.5))
model.add(Dense(43, activation='softmax'))
Complie mô hình
#Compilation of the model
model.compile(
    loss='categorical_crossentropy',
    optimizer='adam',
    metrics=['accuracy']
)
#using ten epochs for the training and saving the accuracy for each epoch
epochs = 10
history = model.fit(X_train, y_train, batch_size=32, epochs=epochs,
validation_data=(X_val, y_val))
Khởi tạo đồ thị kết quả mô hình
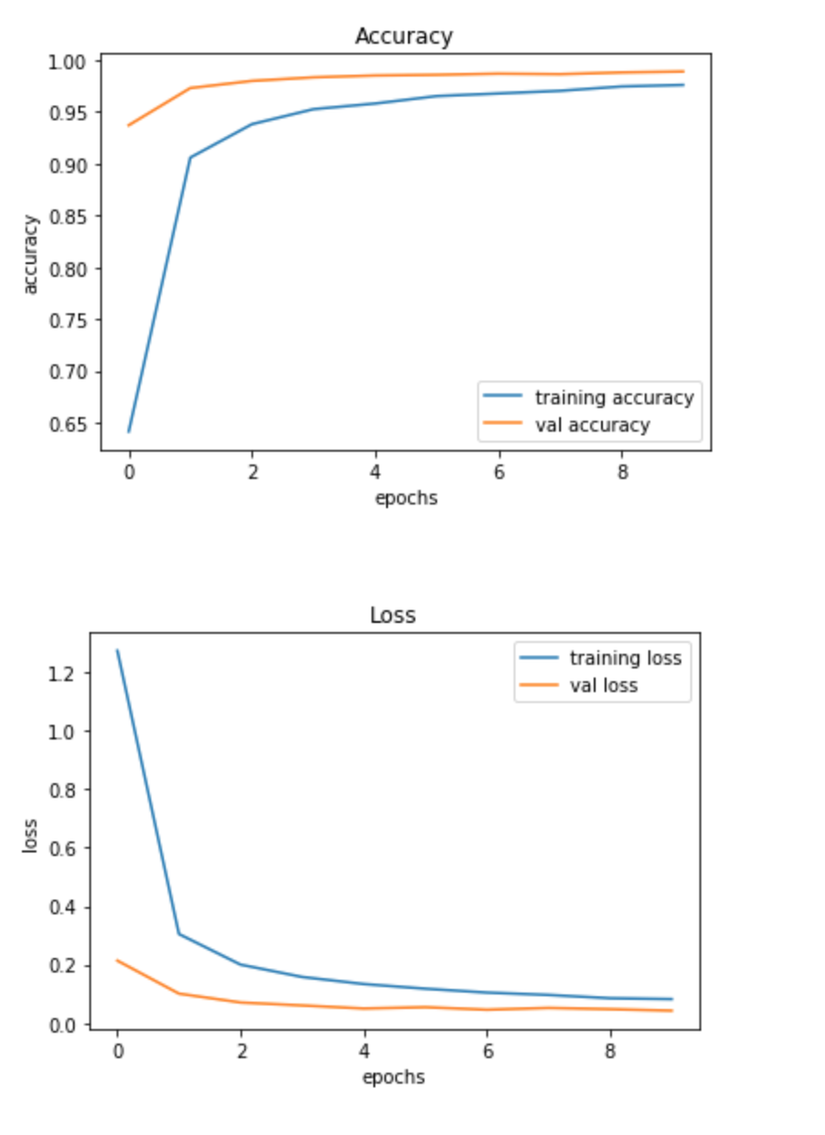
#Display of the accuracy and the loss values
import matplotlib.pyplot as plt

plt.figure(0)
plt.plot(history.history['acc'], label='training accuracy')
plt.plot(history.history['val_acc'], label='val accuracy')
plt.title('Accuracy')
plt.xlabel('epochs')
plt.ylabel('accuracy')
plt.legend()

plt.figure(1)
plt.plot(history.history['loss'], label='training loss')
plt.plot(history.history['val_loss'], label='val loss')
plt.title('Loss')
plt.xlabel('epochs')
plt.ylabel('loss')
plt.legend()
Training
Tiến hành chạy file code
Train on 31368 samples, validate on 7841 samples
Epoch 1/10
31368/31368 [==============================] - 9s 286us/step - loss: 1.2740 - acc: 0.6416 - val_loss: 0.2135 - val_acc: 0.9367
Epoch 2/10
31368/31368 [==============================] - 5s 175us/step - loss: 0.3047 - acc: 0.9056 - val_loss: 0.1006 - val_acc: 0.9726
Epoch 3/10
31368/31368 [==============================] - 6s 204us/step - loss: 0.1999 - acc: 0.9378 - val_loss: 0.0703 - val_acc: 0.9795
Epoch 4/10
31368/31368 [==============================] - 6s 199us/step - loss: 0.1576 - acc: 0.9522 - val_loss: 0.0603 - val_acc: 0.9829
Epoch 5/10
31368/31368 [==============================] - 5s 171us/step - loss: 0.1335 - acc: 0.9577 - val_loss: 0.0497 - val_acc: 0.9847
Epoch 6/10
31368/31368 [==============================] - 5s 171us/step - loss: 0.1175 - acc: 0.9648 - val_loss: 0.0543 - val_acc: 0.9853
Epoch 7/10
31368/31368 [==============================] - 5s 171us/step - loss: 0.1043 - acc: 0.9674 - val_loss: 0.0456 - val_acc: 0.9865
Epoch 8/10
31368/31368 [==============================] - 5s 172us/step - loss: 0.0962 - acc: 0.9699 - val_loss: 0.0517 - val_acc: 0.9860
Epoch 9/10
31368/31368 [==============================] - 5s 172us/step - loss: 0.0849 - acc: 0.9741 - val_loss: 0.0475 - val_acc: 0.9876
Epoch 10/10
31368/31368 [==============================] - 5s 172us/step - loss: 0.0820 - acc: 0.9756 - val_loss: 0.0424 - val_acc: 0.9885
Sau khi thực hiện xong, chúng ta sẽ đánh giá lại mô hình bằng kết quả quá trình training:
Sau khi qua trình training thành công, chúng ta sẽ đánh giá lại bằng tập test
#Predicting with the test data
y_test=pd.read_csv("../input/Test.csv")
labels=y_test['Path'].as_matrix()
y_test=y_test['ClassId'].values

data=[]

for f in labels:
    image=cv2.imread('../input/test/'+f.replace('Test/', '))
    image_from_array = Image.fromarray(image, 'RGB')
    size_image = image_from_array.resize((height, awidth))
    data.append(np.array(size_image))

X_test=np.array(data)
X_test = X_test.astype('float32')/255
pred = model.predict_classes(X_test)
Tính toán độ chính xác:
#Accuracy with the test data
from sklearn.metrics import accuracy_score
accuracy_score(y_test, pred)
Kết quả đạt được là 95.5%, vậy là mô hình khá chính xác rồi.
0.9558986539984164
Lưu mô hình
Sau khi tiến hành traininig lại mô hình nhiều lần chúng ta sẽ thu được một mô hình tốt nhất và sử dụng nó để deploy lên hệ thống thực. Việc này được thực hiện như sau:
model.save('tfsign_model/final_model.h5')
Các bạn có thể tham khảo source code của bài viết tại đây
Cảm ơn các bạn đã theo dõi bài viết hẹn gặp lại trong những bài viết tiếp theo.